

The profiler is the component of Web Benchmark that records and lists duration results for the analysis of performance. It allows you to:
- Collect error reports and execution times (throughput time) of test runs.
- Run a test multiple times.
- Interrupt and then continue a sequence of runs, or skipping runs, or stepping out of a sequence of runs, using the interactive Run Console.
Run Console
The Run Console is an interactive pane that appears in the top-right area of your screen when you run the profiler.
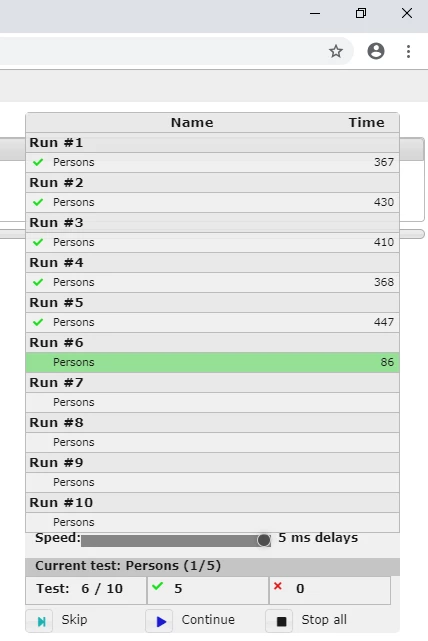
The Run Console visualises where you are in a run, how much time each completed run took so far, and offers buttons for stopping, interrupting, continuing the run, and skipping parts of the run.
The Run Console appears each time you run a profile by clicking Run profiler:

The Run Console looks like this:
Running the profiler
To run the profiler:
1. Select the test you want to run.
2. Click Run profiler:

3. In the "Times to run current test" field, specify how many times you want to run the test, then press Run.
The test is run the specified number of times. During the run, the Run Console is presented in the top-right corner of your screen.
When the profiler completes, an overview of test run information is displayed. This is a good starting point for viewing test results.