

Output to external applications
The earlier instructions in part I of this article enable log output of the SFW, Page engine and even the SQL operations at the application level. At this stage log data is sent out by these sources ,targeting localhost as the data destination via UDP. However, there exists no process yet locally to receive and manage the log data. To include this part we need to introduce a log collector. This also means that the localhost is serving as the log server; you could have targeted another machine as well as shown in the configuration properties of the SFW and Page Engine. After establishing the log server, aggregated logs on that server can be further used by a log visualizer.
The instructions from here on lie outside USoft scope, so we will work on setting up external applications to work towards the final use case of having a visual audit trail.
NXLog
We are free to choose which tool should collect the log data and so we choose nxlog community edition for this purpose.
After installing nxlog, configure it via the nxlog.conf file. NXlog has many configuration features, you can find more details here. An example of such a configuration is listed below, you can edit the paths of the define lines according to your setup.
Panic Soft

#NoFreeOnExit TRUE


define ROOT     C:\Program Files (x86)\nxlog

define CERTDIR  %ROOT%\cert

define CONFDIR  %ROOT%\conf

define LOGDIR   C:\USoft\temp\syslog

define LOGFILE  %LOGDIR%\nxlog.log

LogFile %LOGFILE%


Moduledir %ROOT%\modules

CacheDir  %ROOT%\data

Pidfile   %ROOT%\data\nxlog.pid

SpoolDir  %ROOT%\data


<Extension _syslog>

    Module      xm_syslog

</Extension>


<Input syslog_in>

    Module im_udp

    Host localhost

    Port 514

    Exec parse_syslog();

</Input>


<Input syslog_in_tcp>

    Module  im_tcp

    Host    0.0.0.0

    Port    1514

    Exec parse_syslog();

</Input>

<Output syslog_out>

    Module om_file

    File "C:\\USoft\\temp\\syslog\\logfile.log"

    Exec to_syslog_bsd();

</Output>

<Route syslog_route_udp>

    Path syslog_in => syslog_out

</Route>

<Route syslog_route_tcp>

    Path syslog_in_tcp => syslog_out

</Route>


<Extension _charconv>

    Module      xm_charconv

    AutodetectCharsets iso8859-2, utf-8, utf-16, utf-32

</Extension>


<Extension _exec>

    Module      xm_exec

</Extension>


<Extension _fileop>

    Module      xm_fileop


    # Check the size of our log file hourly, rotate if larger than 5MB

    <Schedule>

        Every   1 hour

        Exec    if (file_exists('%LOGFILE%') and \

                   (file_size('%LOGFILE%') >= 5M)) \

                    file_cycle('%LOGFILE%', 8);

    </Schedule>


    # Rotate our log file every week on Sunday at midnight

    <Schedule>

        When    @weekly

        Exec    if file_exists('%LOGFILE%') file_cycle('%LOGFILE%', 8);

    </Schedule>

</Extension>
We have configured NXLog to receive syslog messages over the network using xm_syslog module and listen to incoming messages over UDP via the im_udp module. The logs are output to a file using the om_file module. We also configure some log rotation and retention for the log files. Again all details are found in the NXLog documentation.
paths in nxlog.conf between double quotes need to have backslashes doubled.
NXLog is installed as a Windows Service and so we can restart this service to reflect the changes in configuration.
Testing output
After restarting NXLog, we should see some resulting log files in the predetermined log directory (C:\USoft\temp\syslog in our example).
The log contents should consist of four types of log messages. They are distuingishable by message structure. We don’t need to go into the details of each type, but they are identified as follows:
- Web request/responses data, originating from SFW:
<142>Jan 22 12:54:31 172.30.60.73 web: server-ip:123.12.12.123 method:GET uri:/usauth/ query:$PageScript=%20-%20LoginPage server-port:8090 client-ip:123.12.12.123 (via xff) client-user-agent:Mozilla/5.0 (Windows NT 6.3; Win64; x64) AppleWebKit/537.36 (KHTML, like Gecko) Chrome/88.0.4324.104 Safari/537.36 client-referer:https://test.test.com/
- Web session monitoring, originating from SFW:
<38>Jan 22 12:54:32 172.30.60.73 session: Authentication successful: session-id=1fe9a2b5-4155-4a13-b20a-f6d12055c0ae session-name= user-name=x
- Web client state and its generated queries, originating from the Page Engine:
<142>Dec  2 11:48:19 172.30.60.73 audit: [Query]    invoke rulesengine.getResource with select 'UserGroup.firstPageWeb'
<142>Dec  2 11:48:19 172.30.60.73 audit: [Query]    SELECT DS342.LANGUAGE_CODE "$343" FROM AUTH_SYS_LNG DS342 WHERE active = 'Y' ORDER BY 1 ASC
<142>Dec  2 11:48:19 172.30.60.73 audit: [Response] {"stateId":"17","lang":"en","loginStatus":"true","logonRequired":"true","defaultPage":"User Management","eventState":"success","commit":"false","module":".","Auth":{"menu":"administrator"},"Data":[{"queried":"Y","dsId":"1.DS342","maxDataSetSize":0,"Rows":[{"refId":"21","Row":[{"$343":"en"},{"$343":"nl"}]}],"Keys":["$343"],"ExtraKeys":[],"Inserts":[]},{"queried":"N","dsId":"1.DS258","maxDataSetSize":0,"Keys":[],"ExtraKeys":[]}],"Message":[]}

<142>Dec  2 11:48:19 172.30.60.73 audit: [Request]  {"stateId":"19","lang":"en","Pages":[{"name":"User Menu"}],"Sort":{"1.DS7":{"$14":"ASC"},"Selections":{"1.DS233":{"Sel":[{"Keys":{"$234":"PIA90","$235":"test"},"ri":"147"}]},"1.DS321":{"Sel":[{"Keys":{"$322":"","$323":"A","$327":"2020-12-02T00:00:00","$328":"","$329":"","$330":"","$331":"","$332":"","$333":""},"ri":"12"}]}},"Manipulations":[],"Event":[{"name":"getDataSet","beginRec":"1","count":"10","doCount":"true","refId":"23","alias":"DS7","Params":{"SEARCH_VALUE":"","something":""}}]}
- Application SQL, originating from USoft application(via the Syslog C# client, with XML originating from custom LOGUTIL component mentioned earlier):
<110>Apr 17 12:20:33 AUDIT_EXAMPLE USR_ACC[u]: <!-- On Thu 17 Apr 2021 12:20:33 test5 updated USR_ACC( ACC_ID, USR_ACC). ACC_ID: '100' USR_ACC: 'test123' FIRST_NAME: 'John Doe' changed to: 'John test' --> <USR_ACC TIMESTAMP="2020/1217122033" USER="test5"> <ACC_ID key="100" /> <USR_ACC key="test123" /> <FIRST_NAME old="John Doe" new="John test" /> </USR_ACC>
Troubleshooting and things to consider
Should you expect, but not see one of these messages or should you not see any log file being appended at all, make sure that the NXLog service is (re)started after configuration. Also, should you apply a different (external) host for the log server, make sure that you are using the correct domain name in the <Socket> element name attributes within the SFW log4j2.xml. Note again that the SFW and Page Engine configuration is reset after publishing, something to keep in mind.
Also make sure the host is reachable and no firewall or network restrictions are intervening. If necessary, a network packet trace, e.g. using Wireshark could be done to inspect network traffic on a detail level.
In our example, we demonstrated NXLog setup using a Windows operating system, though all should work pretty much the same on a Linux operating system. Also, notice we use UDP for transmitting syslog log data, though TCP could have been applied instead. However, it is preferred to use UDP in this case, because it works faster in practice, because the TCP protocol uses handshakes for initiating a connection, and an acknowledge if the messages sent through have arrived. UDP however is ‘connectionless’, which means no handshake and acknowledge is required.
Also, we demonstrated a single-tenant NXLog setup, though a multi-tenant setup with NXLog would be equally possible. The procedure would involve re-applying the SFW and Page engine configuration for every host, directing the log data to a centralized NXLog log server.
Let us know in the comments should you run into issues or have questions setting up this part.
Applying to an external target: Elastic
The foundation for a proper audit trail is established. As you may have noticed from the log message output, it lacks the readibility and accessibility required for an audit trail. We require some way to visualize the syslogs to make them suitable for audit trails. Filtering and searching structured log messages would be desirable by now. The end result should provide us with a representable view of the syslog logs, suitable for audit trails.
We will apply the widely used Elastic Stack as a solution. Elastic is an open source product, licensing is involved at a certain point, depending on the desired features and support level, though for demo purposes we can utilize the free, open source on premises solution. We will work with the Windows version , as was the case with NXLog, but the following should apply in case of Linux OS.
Overview
We will work with the complete Elastic Stack(ELK 7.9.3) for this demo: Filebeat, Logstash, ElasticSearch and Kibana, though it is possible to use NXLog as the collector and parser for Elastic, replacing the need for Filebeat and Logstash. More about this will be explained later on. Pictorially the ELK demo setup is:
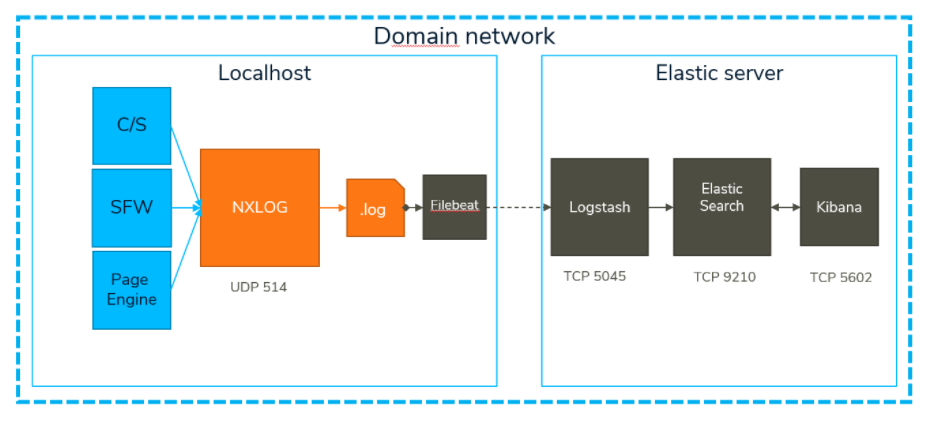
The Elastic stack could just as well reside on the localhost machine (or NXLog on the Elastic server side), but for this demo a seperate machine is used dedicated to Elastic. All Elastic network traffic is in TCP, each process on the Elastic Server has its own specific listener port. Although each Elastic component has configuration steps, we will omit the details in this article, as Elastic provides alot of documentation that will most certainly allow you to manage the configuration for your situation. We will only include the important take aways when setting up the Elastic Stack.
Filebeat: shipping logs
The content of log file is harvested by Filebeat and shipped from the log server to Logstash for further processing. You can install Filebeat on the localhost and follow the quick start instructions. The take-away here is to configure filebeat.yml to read the log directory instead of a single log file via the input configuration , should you have multiple log files for retention purposes.
Logstash: parsing logs
Logstash is key to filtering and structuring the logs for further use by Kibana. Install Logstash on the Elastic Server side and follow the instructions. Applying filters in the pipeline configuration enables structurizing incoming log messages, more specifically using grok for pattern matching. We apply custom grok patterns to parse specific message paterns via regular expressions:
MSGTYPE <.*?>
TABLE [^'\[]*
SIDU \[.*?]
COLUMNS \(([^)]+)\)
VAL .+?(?=-->)
OLDVAL /(\w+){1}:\s+('[^']+'|\w+)\s+('[^']+'|\w+)
XML .*
The grok patterns that correspond to the log messages listed earlier are:
 grok

    {

      patterns_dir => [
        "./patterns"
    ]

      match => {
        "message" => [
            "%{MSGTYPE:pri}%{MONTH:month} +%{MONTHDAY:day} %{TIME:time} %{IPORHOST:host} %{TABLE:tbl}%{SIDU:sidu}: <!-- On %{DAY:day} %{MONTHDAY:day} %{MONTH:month} %{YEAR:year} %{TIME:time} %{WORD:appuser} %{WORD:operation} %{TABLE:tbl}%{COLUMNS:cols}. %{VAL:values}",
            "%{MSGTYPE:pri}%{MONTH:month} +%{MONTHDAY:day} %{TIME:time} %{IPORHOST:host} %{WORD:msgtag}:  %{DATA:msginfo}: session-id=%{UUID:session_id} session-name=%{WORD:session_name} session-protocol=%{WORD:session_protocol} authenticated=%{WORD:authenticated}",
            "%{MSGTYPE:pri}%{MONTH:month} +%{MONTHDAY:day} %{TIME:time} %{IPORHOST:host} %{WORD:msgtag}:  %{DATA:msginfo}: session-id=%{UUID:session_id} session-name=%{WORD:session_name} user-name=%{WORD:username}",
            "%{MSGTYPE:pri}%{MONTH:month} +%{MONTHDAY:day} %{TIME:time} %{IPORHOST:host} %{WORD:msgtag}:  %{DATA:msginfo}: session-id=%{UUID:session_id} session-name=%{WORD:session_name} session-protocol=%{WORD:session_protocol} authenticated=%{WORD:authenticated} user-name=%{WORD:username}"
        ]
    }
}
You can use Elastic's Grok debugger to test patterns against your own messages, or use an online Grok debugger. Note that you must have Kibana installed and running to access the Elastic Grok debugger.
You can notice that we have filter patterns for the C/S application messages and the session monitoring messages. The Page Engine log messages are excluded from this demo.
We can also further process incoming messages by conditionally adding fields to certain log messages. We use mutate to add a field “action”.
#add action field to map SFW and C/S log event details

mutate {

    add_field => {
        "action" => "none"
    }
}
Which for example allows you to further process session logins by adding descriptive fields:
if "logged in" in [msginfo
] {

    mutate {    replace => {
            "action" => "logged in"
        }
    }

    mutate {    replace => {
            "values" => "%{username}"
        }
    }
}
Or you can replace the default values of “action” based on some event:
if "USER_ACCOUNT" in [tbl
] and [sidu
] == "[i]" {

    mutate {    replace => {
            "action" => "Added account"
        }
    }
}
This facilitates readibility of your audit logs.
Logstash will direct its output to ElasticSearch and write to a certain index. As Logstash works with output specification just like Filebeat, the take-away here is try to reduce the number of indices created by the ElasticSearch engine when using dates for the index name. For example, the following would create indices seperated by months:
index => "audit_example-%{[@metadata][version]}-%{+YYYY.MM}"
Whilst having the days included will increase the number of indices:
index => "audit_example-%{[@metadata][version]}-%{+YYYY.MM.DD}"
This would create indices on a daily basis, which might not be desirable for your use case.
With your pipeline configuration properly setup you can run Logstash together with Filebeat, ElasticSearch and Kibana to start seeing your log messages being indexed and displayed in Kibana.
Kibana: vizualizing as audit trail
With Kibana installed, the previously mentioned index pattern must first be added in order to start seeing log entries in the Discovery panel, which is the main panel we will use for the audit trail.
From here on you can apply Kibana search and filter features to construct the audit trail view according to you needs. To test these features, a live demo of Kibana is found here.
For example, in the search below, you can see the result of the parsed messages by Logstash filter, with the field mappings corresponding to the columns:
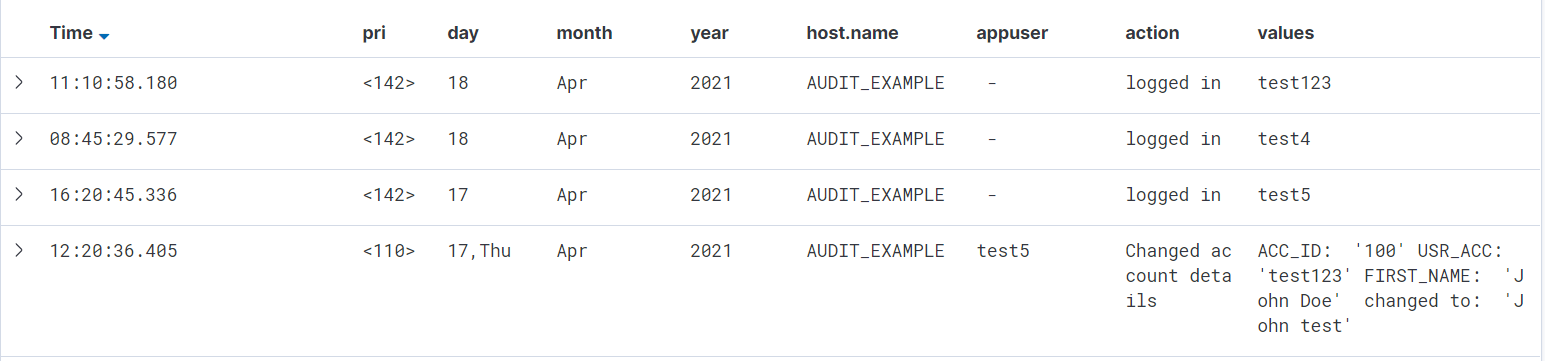
The first three rows show the session monitoring messages, while the last one shows the C/S application SQL operation, namely that user test5 has changed the account details of user test123. Notice the extra addd “action” field to the right, this log data was not included in the original log file, but was the result of the mutate filter used in Logstash.
You might have noticed that the “pri” field has not been not further parsed, though that would also have been possible as well using the syslog_pri in Logstash.
Considerations
It is possible to use NXLog instead of Filebeat and Logstash , which forms the KEN Stack. Similar to Logstash, NXLog provides grok modules for processing, more information is also found here. It may be that Logstash has the additional filter features that may be necessary for your use case.
Also notice that we have not included the setup of security, authentication and role management for Elastic (Kibana), though these features are available. Also please mind that, as our Elastic setup is aimed at demonstrating the audit trail possibilites, it is a R&D setup and not intended or representable for production use.
In production use you might have multiple tenants involved, take for example multi tenant USoft web applications with web request logging being routed to a single log directory, having requests originating from different customer web application instances. Such logging access should be isolated per customer. Elastic is capable of implementing such security via seperate index priveleges with role based read/write restriction and even allows field level security.
Conclusion
With all of the above steps completed, you will have a complete audit trail for your application running. Keep in mind, that this is for a single application of a single customer (tenant), although expanding it to a multi-tenant configuration is not so much work, for example:
For every tenant, you can send the logging data to a different UDP port (instead of the default 514). Within Nxlog (or another log server), you can then configure different ports for each tenant, and partition the received logs for each tenant to be picked up by Filebeat to be passed on further in the stack eventually. Alternatively, you could also tag each log line with the name of your tenant, and let Nxlog parse the information, but that is probably more work and a more difficult solution as well.
With the logs of every tenant separated, you can treat them properly as being from different sources. From there on, it is pretty much a copy of the demonstrated setup.
And even though it may seem a lot of trouble to set up and maintain the demonstrated setup, having no proper audit trail configured for your application will ultimately prove to be a lot more work and trouble, especially in the case of a data breach. Because in that case, all of the investigative work will have to be done manually, and a lot of free information such as login/logout logging might not even be present at all. Finding the cause and the impact of a breach may even become impossible then.
Learn more and read: Syslog logging for audit trails - Part I