
What do you do as a USoft practitioner when a client shows you a decision table?
USoft Studio is for specifying rules. USoft Definer is for implementing rules. But... you cannot draw a decision table in USoft Studio, and the Rules Engine you build in USoft Definer listens to business rules, not to decision tables.
Here is an an analysis and some suggestions. You must have come across decision tables yourself! Please add any comments, criticism and ideas that you have.
This is a 2-part article. This Part 1 explores what decision tables really ARE. Part 2 talks about how to apply decision tables in the USoft platform.
Introducing Decision Modelling
Say, your client is a local council. They must be able to decide if people are eligible for housing benefit. They have old software that helps them make this type of decision. They want to replace this software by a rules-based USoft application. Your task is to build the new application with them. To be successful, you need to know how they make decisions.
You ask how they decide if a person is eligible for housing benefit or not.
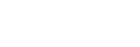
Part of their answer is that this depends on the person's budget flexibility. To explain how this works, they give you a decision table:
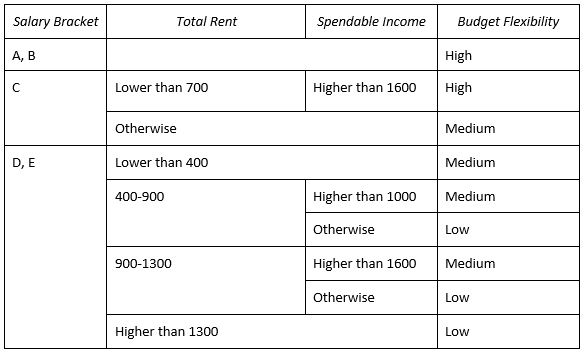
If you develop In USoft, where do you put such a decision table? It's a very good question, since USoft sports a sharp distinction between specifications made in USoft Studio in the form of business rules and diagrams, and implementations made in USoft Definer and other tools in the form of tables, constraints and other artefacts. The specifications only describe the solution. The implementations are the working software solution. This software has a Rules Engine inside.
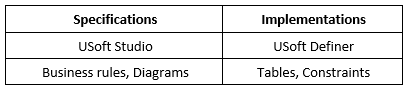
At first sight, a decision table looks like a specification. It is a description or prescription of what must be implemented. What it contains seems equivalent to the sort of business rules you would formulate in USoft Studio:
A decision table is visually somewhere in the middle between diagrams (such as BPMN diagrams) and text (such as business rules). Unfortunately, USoft Studio currently does not let you "draw" a decision table. It's much easier to get the "table look" in USoft Definer, where you can simply define tables and columns and then populate them with data. This second approach could also allow the users of your application to edit and change the decision table directly.
So what are decision tables in USoft? Are they specifications or implementations? And why can't you draw decision tables in USoft Studio?
Confusing, but true: decision tables have nothing to do with the decisions that you can define in USoft Definer.
Of course, you could put decision logic in those decisions, but that's just because you can always put any basic logical structure in any interface for programming or scripting. You can just as well put logic in the program code of an RDMI component, or in a USoft Blend script. (This is not to deny that, at times, USoft Definer decisions, with their ability to branch between Yes Actions and No Actions and to call each other via ActionDecision(), can be the perfect instrument for implementing a decision table, especially when your decision logic is part of a USoft Definer job.)
This is Part 1 of a two-part article. This Part 1 explains what decision tables really are. Part 2 will look at how decision tables are best embedded in USoft.
The Decision Model (2010)
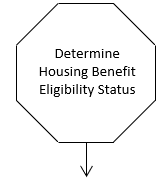
In The Decision Model >von Halle and Goldberg, The Decision Model, Auerbach Publications, 2010], von Halle and Goldberg use an octogonal shape and a downward-pointing arrow for important business decisions such as determining whether someone is eligible for housing benefit. This symbol expresses the purpose or the final conclusion of the decision-making:
Von Halle and Goldberg use a tombstone-like symbol to describe what is needed to make a decision:
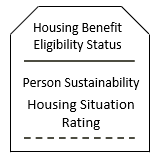
This tombstone expresses that a person's Housing Benefit Eligibility Status depends on two things: the person's Person Sustainability, and the person's Housing Situation Rating. A tombstone always contains a solid horizontal line. The text above that line names the decision. The text below that line names the things that the decision depends on.
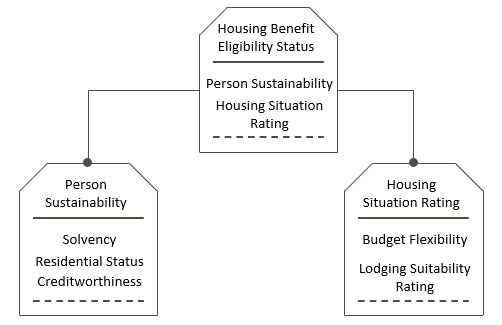
As it turns out, in this case, each of the 2 things that the decision depends on is a conclusion of a further decision made earlier. If a decision depends on another decision, a connecting line is drawn between the tombstones. A dot is placed at the line end of the decision you need to take first:
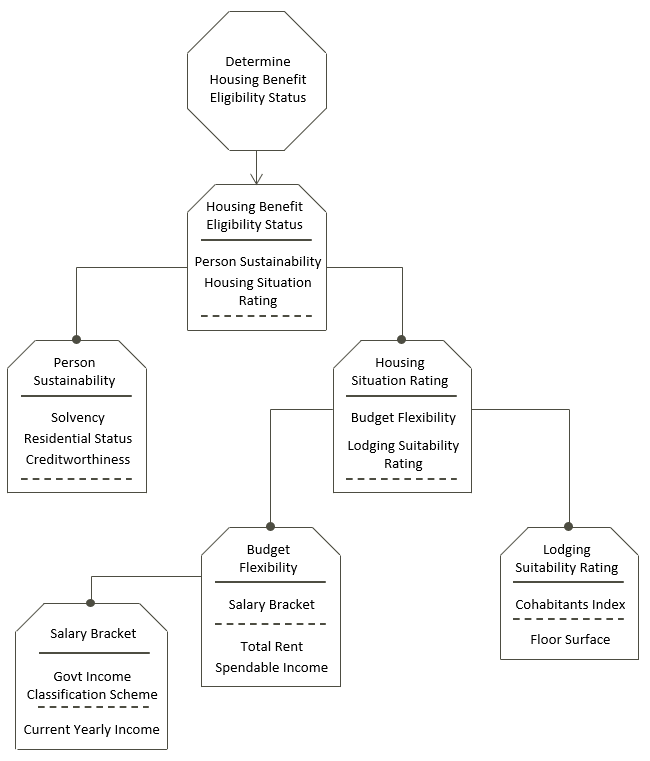
Here is almost the entire decision structure for finding out if a person is eligible for housing benefit. For brevity, some details have been omitted:
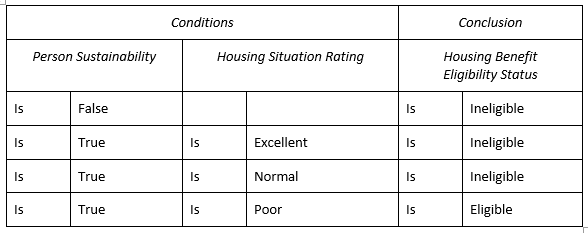
Here is the decision table for a person's Housing Eligibility Status:
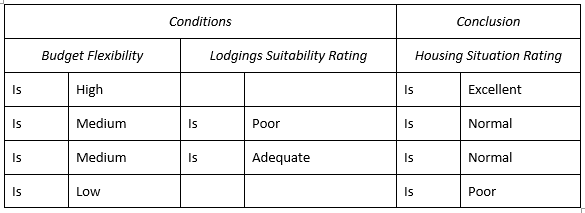
Here is the decision table for a person's Housing Situation Rating:
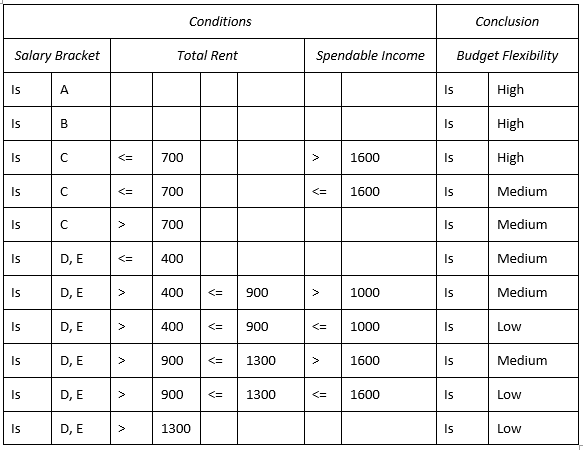
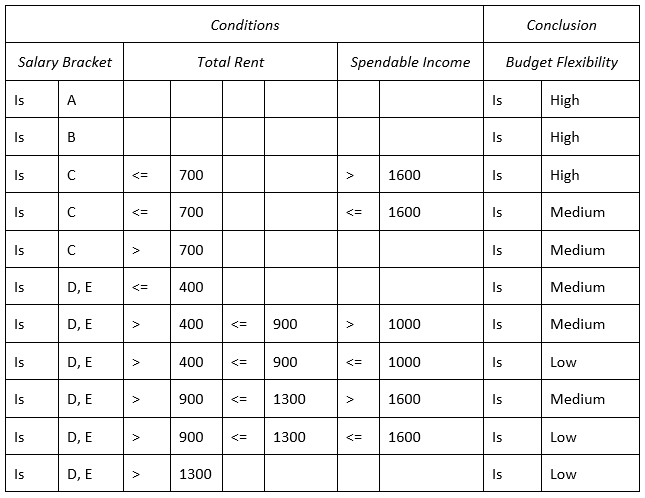
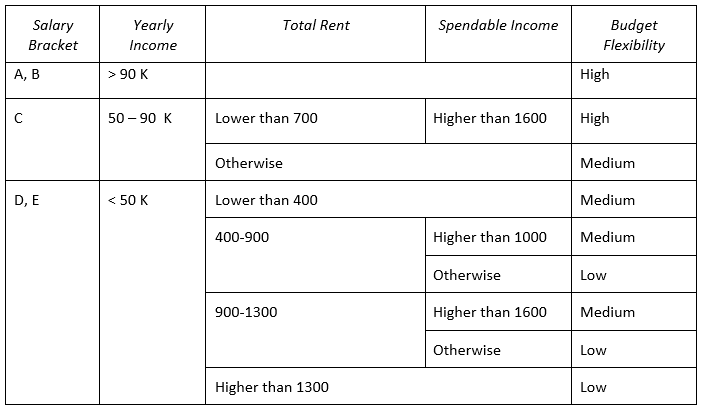
Here is the decision table for a person's Budget Flexibility:
As you can see, to find a person's Budget Flexibility, you need to know the person's Salary Bracket, Total Rent and Spendable Income, but only Salary Bracket requires a further decision. Total Rent and Spendable Income are simply data provided inside the decision table. In the tombstone symbol, this is expressed by placing these data below a dotted line:
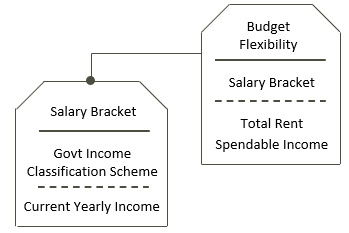
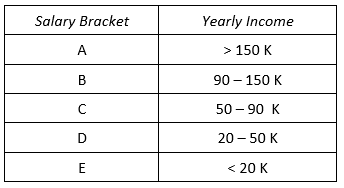
(To determine the Salary Bracket can hardly be called a "decision": it will just involve looking at a table on the Government's web site that tells you in which lettered bracket the person's Current Yearly Income falls.)
Decision Model and Notation (DMN) (2015)
The Object Management Group (OMG) formalised decision-making in its 2015 Decision Model and Notation (DMN) standard rfreely available at https://www.omg.org/spec/DMN/].
DMN has a three-tiered structure. In a BPMN process flow diagram, a decision activity shows that at some specific point in a business process, a decision is required. At the second tier, a decision requirement diagram shows what is needed to take that decision. At the third tier, decision tables are typically needed to express how a decision is made:
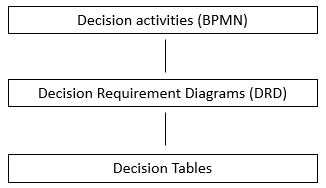
Each tier is optional.
Decision activities (BPMN)
In a BPMN process flow diagram, you can express that a decision must be taken at some point in the business process. Draw an activity symbol with a table icon in the top-left corner. This turns the activity into a decision activity:
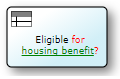
To draw this in USoft Studio, choose Activities, Task, Business Rule from the diagrammer menu.
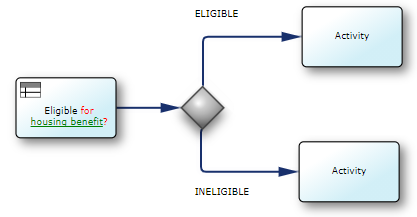
A decision activity is typically followed by a gateway that opens a branch for each of the possible outcomes of the decision:
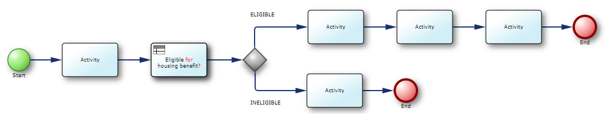
This structure could be part of an overarching business process:
Decision Requirement Diagrams (DRDs)
Decision requirement diagrams (DRDs) are the DMN counterpart of the Decision Model's tombstone diagrams. They express how decisions depend on each other to arrive at the final conclusion:
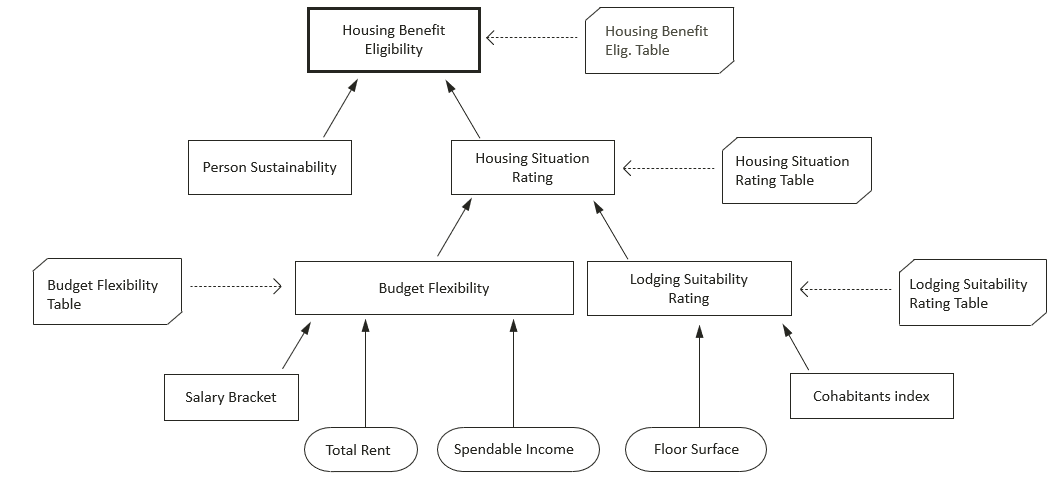
In a DRD, decisions are rectangles. The top-level decision has a thick border. Arrows point from what is required for a decision to the decision itself. Knowledge in decision tables is represented by special rectangles with angled left-top and right-bottom corners. Data is represented by "sausage shapes" that appear typically near the bottom of the diagram.
Decision Tables in DMN
Decision tables in DMN look essentially like decision tables in The Decision Model. Just to give you a flavour, here is another version of the earlier Housing Benefit Eligibility table, this time in DMN style:
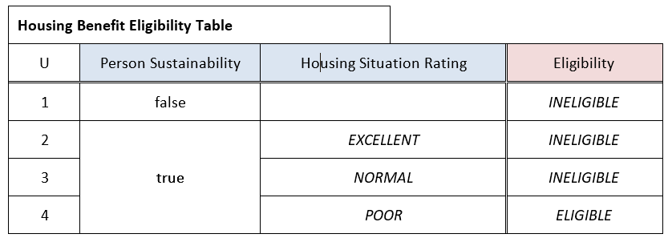
Most of the differences are cosmetic. The letter "U" in the top-left corner (for "Unique") shows the hit policy. This "U" means that the table is constructed in such a way that each case from the business reality matches exactly 1 of the rows (or: rules) in the table. More on hit policies in the next section.
One of the many aspects skipped here is DMN's interest in making decision structures callable from programming code through boxed expressions, a sibling notation to the decision tables themselves.
This has been only the briefest of introductions to DMN and The Decision Model. In reality, the DMN 1.1 specification covers no less than 182 pages in PDF. The Decision Model is a 500-page hardcover book!
This summary introduction was long enough for you to appreciate that the authors of DMN have essentially re-used all the central ideas that were already present in The Decision Model. Even the idea of calling decisions from process flows was already there.
Non-normalised tables
All the decision tables we've seen so far followed the same pattern, because they were all normalised.
Normalisation is a logical theory. Decision tables, just like relational database schemas, can have different levels of normalisation. You could easily write a whole textbook on normalisation. Here, we’ll keep it short. You can say that a normalised decision table is a decision table that offers:
- A single Conclusion column, on the right-hand side. (You will typically have multiple Condition columns.)
- Rules (or rows) that are mutually exclusive, ie., that do not overlap. Each case from reality matches exactly 1 rule.
- A collection of rules that is complete: the table as a whole allows you to reach a conclusion (make a decision) for each conceivable case from reality.
Normalised tables held together by a tombstone diagram (in Decision Model) or by a DRD (in DMN) are an optimal way of representing underlying logic: the structure of derivation rules that together help you make an important business decision. This is also the information you need for mapping decision tables to SBVR business rules written in USoft Studio, and to USoft constraint SQL in USoft Definer.
This last section of Part 1 looks at non-normalised tables. As you will find out when you read Part 2 about decision tables in USoft, you don't ever strictly need non-normalised tables to express logic. So why bother about non-normalised tables at all?
Normalised tables are not necessarily the most reader-friendly solution. For this reason, in your everyday reality of blogs, leaflets, newspapers and infographics, you are much more likely to come across non-normalised tables.
Quite unlike normalised tables, non-normalised decision tables come in a wealth of different presentation formats, including mixed formats. If you are not aware of non-normalised tables, you are likely to get overwhelmed, sidetracked, or even discouraged by them.
Non-normalised tables can be badly designed.
If they are well-designed, value them as a graphic format: a useful alternative presentation for what is actually, under the cover at the logical level, a normalised structure.
Here are different types of non-normalised tables.
Combined cells
To make decision tables more readable, you can bring together similar information in the same cells, or you can omit unimportant cell boundary lines, or a combination of both. This Budget Flexibility table:
is easier to understand in this version:

Combined tables, changed axes
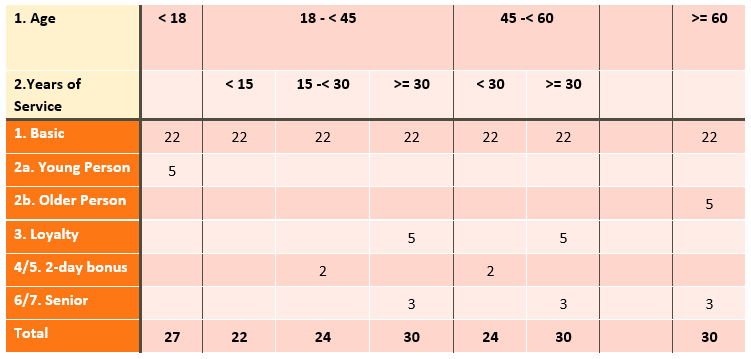
The Decision Model's style of normalisation leads to a large number of comparatively small tables. Depending on purpose, it could be acceptable and desirable to combine information from multiple tables.For example, you could integrate this table:
into the last table from the previous section as follows:
If you have decisions for calculating distinct types of holiday days for employees, it is tempting to integrate all those holiday calculations in a single matrix and use a special added column or row to display sums of results. It is also attractive to put the conditions across the top of the table, and the types of decision down the left. The cells in the middle become crossroads where you display the conclusions (a strategy called crosstab table in DMN). This display makes a large number of different rules optimally readable:
Hit policies
In your decision table, if you allow rules that overlap, a case from reality could match multiple rules or rows. The outcome could be multiple conclusions instead of a single, determinate conclusion. In such a case, you need to supply additional information so that the reader knows what to do with the multiple outcomes: simply return them all? aggregate them, maybe by computing a sum or average of outcome numbers? return the first and discard the others? or return the last?
DMN laboriously standardises various hit policies: standard ways of organising this. We saw earlier that, in DMN, the letter "U" for "Unique" may be displayed in the top-left corner of the table if rows are mutually exclusive, as a signal that the table is guaranteed to return only one conclusion. The letter "F" for "First" must be displayed if the table is to be read from top to bottom and the first matching row applies, so that any later matching rows must be discarded.
It is questionable that the various DMN hit policies are frequently needed or even particularly well-designed. The ideas behind most of the hit policies (multiple outcomes possible, row order influences result) are contrary to the set-oriented nature of the Decision Model. DMN’s letter system for indicating hit policies is abstract. It is hard to memorise and apply.
Still, it's a good idea to keep in mind that decision tables can have different hit policies.
Infographics
This final section makes a very general point, independently of the previous sections.
You can make decision tables more reader-friendly by applying graphic design. Here is a version of the Housing Benefit Eligibility table in which minimal graphic strategies create a better-looking table. This table uses icons instead of text, italicises and positions text, omits cell border lines, and stresses horizontal division lines:
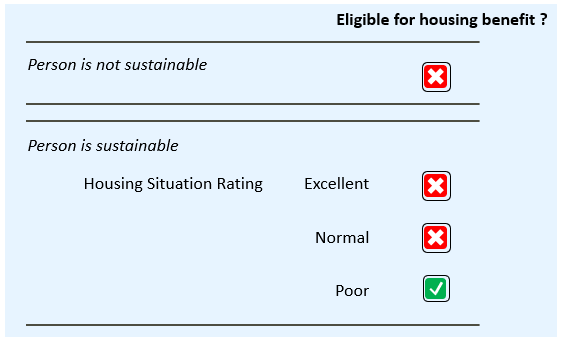
The possibilities are endless. You could use arrows, circles, boxes, sizes, colours, 3-D pictures, data cubes, geographical maps, stock images, and images ordered from artist designers.
This Part 1 has offered an overview of decision tables. Part 2 will talk about what is the best way to apply decision tables in USoft applications.
Tell us what you think
Do you have special tips for decision tables in USoft?
Do you want to share a successful way of using decision tables in USoft?
What do you need around decision tables to make your work easier?
Please let us know by replying to this blog.
Thank you!