


This article is an introduction to E/R diagrams in USoft. It gives team members an overview of the purpose and features of this diagram type in a USoft context.

In USoft 10, if you are a developer and you want to create E/R diagrams, or you want more details on diagram symbols, please go to the Home page of USoft Studio. On the Help tile, on the Diagrams tab, open the PDF document about E/R diagrams.

In USoft 11, if you want to create E/R diagrams, click here.
What is an E/R diagram?
An Entity-Relationship (E/R) diagram, also referred to as Entity-Attribute-Relationship (E/A/R, EAR) diagram, visualises data structure in a relational database by showing:
- A box for each database table. These boxes are referred to as an entities in the diagrammer.
- A list of textual items inside each box. These represent database columns. They are referred to as attributes in the diagrammer.
- Connecting lines between boxes. These lines represent parent-child relationships between 2 tables, except when they have an arrowhead, in which case they represent supertype and subtype tables.
The example below shows a structure of 5 related tables. It contains a "client" supertype and a "contractor" subtype. This is indicated by an arrow connecting "client" to "contractor". The arrow points at the supertype: it points away from the subtype.
Contractors are clients, so they are identified by a client ID. The small red key symbol indicates that "client ID" identifies a client uniquely. Each constractor has a mandatory name, but because other clients also have a name, this name is in the "client" table and not in the "contractor" table. The fact that client names are mandatory is indicated by a red rectangle. Unlike other clients, contractors can have something called a "contract mode". This makes "contract mode" a subtype attribute: a column in the subtype table.
A contractor can pay for multiple rentals; each rental is paid for by exactly 1 contractor. The relationship is a classic parent-child or 1-to-many relationship, in which "contractor" is the parent and "rental" is the child. The fork-like indicator on the "pays for" line at the line end hitting the "rental" box indicates that it is "rental" that is child in this relationship.
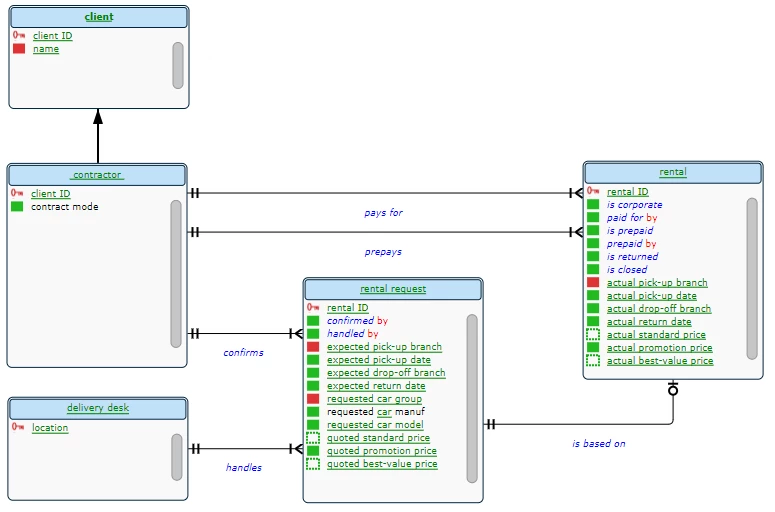
This example favours a naming style. The foreign key in "rental" indicating which contractor pays for the rental is named "paid for by". The advantage of this style is that USoft Studio automatically links this column name to the "contractor pays for rental" verb concept, as you can see when you hover the text "paid for by", and also when you click on it. It is also possible to call the foreign key (for example) "contractor ID". This has different advantages.
Likewise, the column name "is corporate" in "rental" has been chosen because it allows automatic linking to the "rental is corporate" unary verb concept. This column has Yes or No for values, and is probably implemented in GUIs as a checkbox.
The relationship between "rental" and "rental request" is a special case of a parent-child relationship. It is not a conventional 1-to-many relationship. "Rental" is the child, but instead of a fork-like symbol at the line end of the relationship hitting the "rental" box, we see a zero and a dash. This indicates that a rental request has a minimum of 0 and a maximum of 1 child.
What is an E/R diagram for ?
In USoft, E/R diagrams are the primary diagram type for visualising implementations, because the USoft Rules Engine relies heavily on relational data structure for expressing rule implementations.
The great added value of an E/R diagram is the immediate visual impression it gives of data structure. You can see at a glance which tables are connected to which other tables, and how in a relationship one table is parent and the other child. Seasoned USoft developers are able to quickly derive important information from these visual structures, for example:
- If a table is only in a single relationship where it is parent, it is likely a domain table, or lookup table: a table that lists possible values for use in the child.
- If a table is a child in multiple relationships, it is likely an intersection table: a table used to record many-to-many relationships between two parents, as when a customer can sign multiple contracts but a contract also has multiple signatories.
- If a table is unconnected to other tables, a relationship is probably missing.
Because connected tables must be drawn closely together to avoid a "spaghetti" of connecting lines, E/R diagrams automatically act as data maps as well: you can immediately see which tables "cover" which functional areas.
E/R diagrams' special status in the USoft approach
The USoft approach is a dual approach where you keep specifications of business logic on the one hand, and software implementations on the other, and you have special tooling to connect and maintain the two. In this approach, most diagrams are conceptual models, a kind of specification, just like natural-language business rules are part of concept models. USoft Studio is the primary tool for creating and keeping specifications.
E/R diagrams describe implementations: actual database structures, not conceptual models. Therefore you would expect E/R diagrams in USoft Definer, not in USoft Studio. The only reason why E/R diagrams are often drawn directly in USoft Studio is that this allows USoft more easily to apply the automatic colour-coding and navigation features that it also applies to other diagram types.
In terms of work division and collaboration, this special status of E/R diagrams may call for some clear decisions on task division in your team. You may or may not have a division between people primarily responsible for specifications and other people primarily responsible for software implementations. However you may have otherwise organised these task divisions, E/R diagrams are best created and maintained by the people who actually implement the data model in USoft Definer.
USoft offers an option to generate E/R diagrams directly in USoft Definer on the basis of data models defined there:
1. Make sure that you have a Business Object that contains the subset of tables that you want to see in your E/R diagram.
2. In USoft Definer, on the Teamwork tab of the catalog, right-mouse-click a node for that Business Object and choose either "Generate Diagram" or "Generate Diagram and Browse".
This gives you an E/R diagram in which you probably need to reposition the table boxes manually so that the diagram looks good. In particular, you probably need to take action so that the relationship lines between the tables do not cross. You can export the result to USoft Studio and import it there to get colour-coding and navigation to SBVR concepts, if you wish.